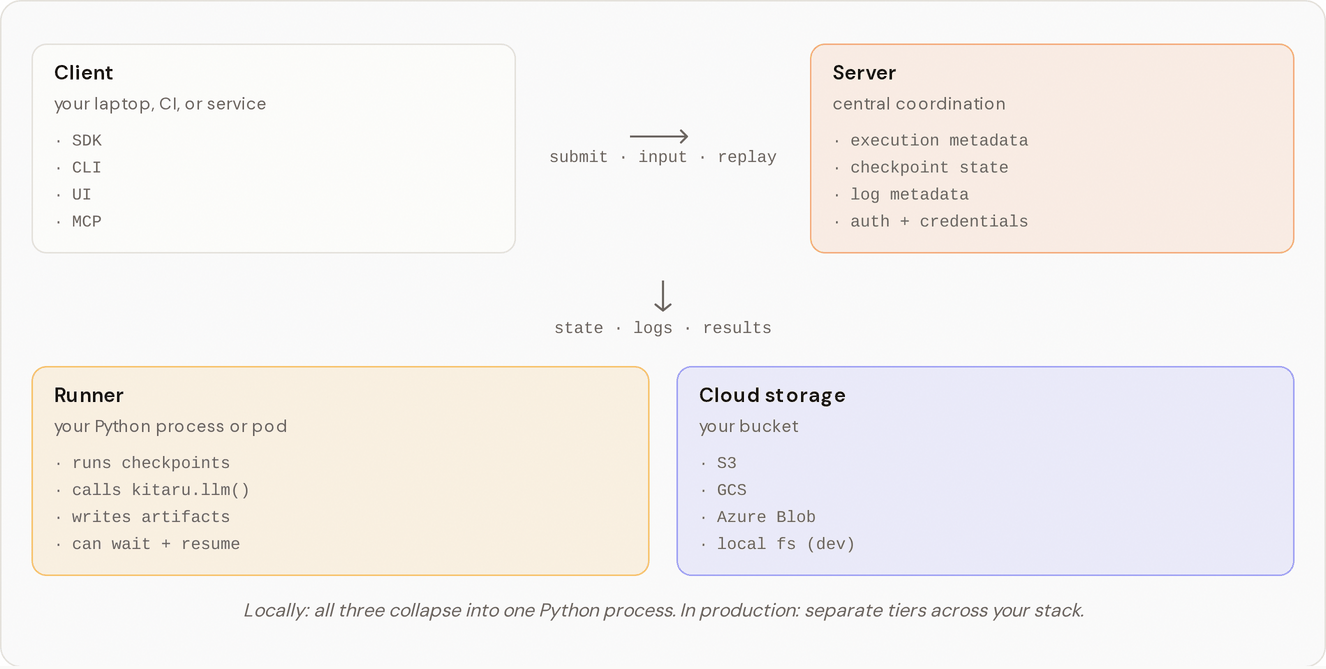
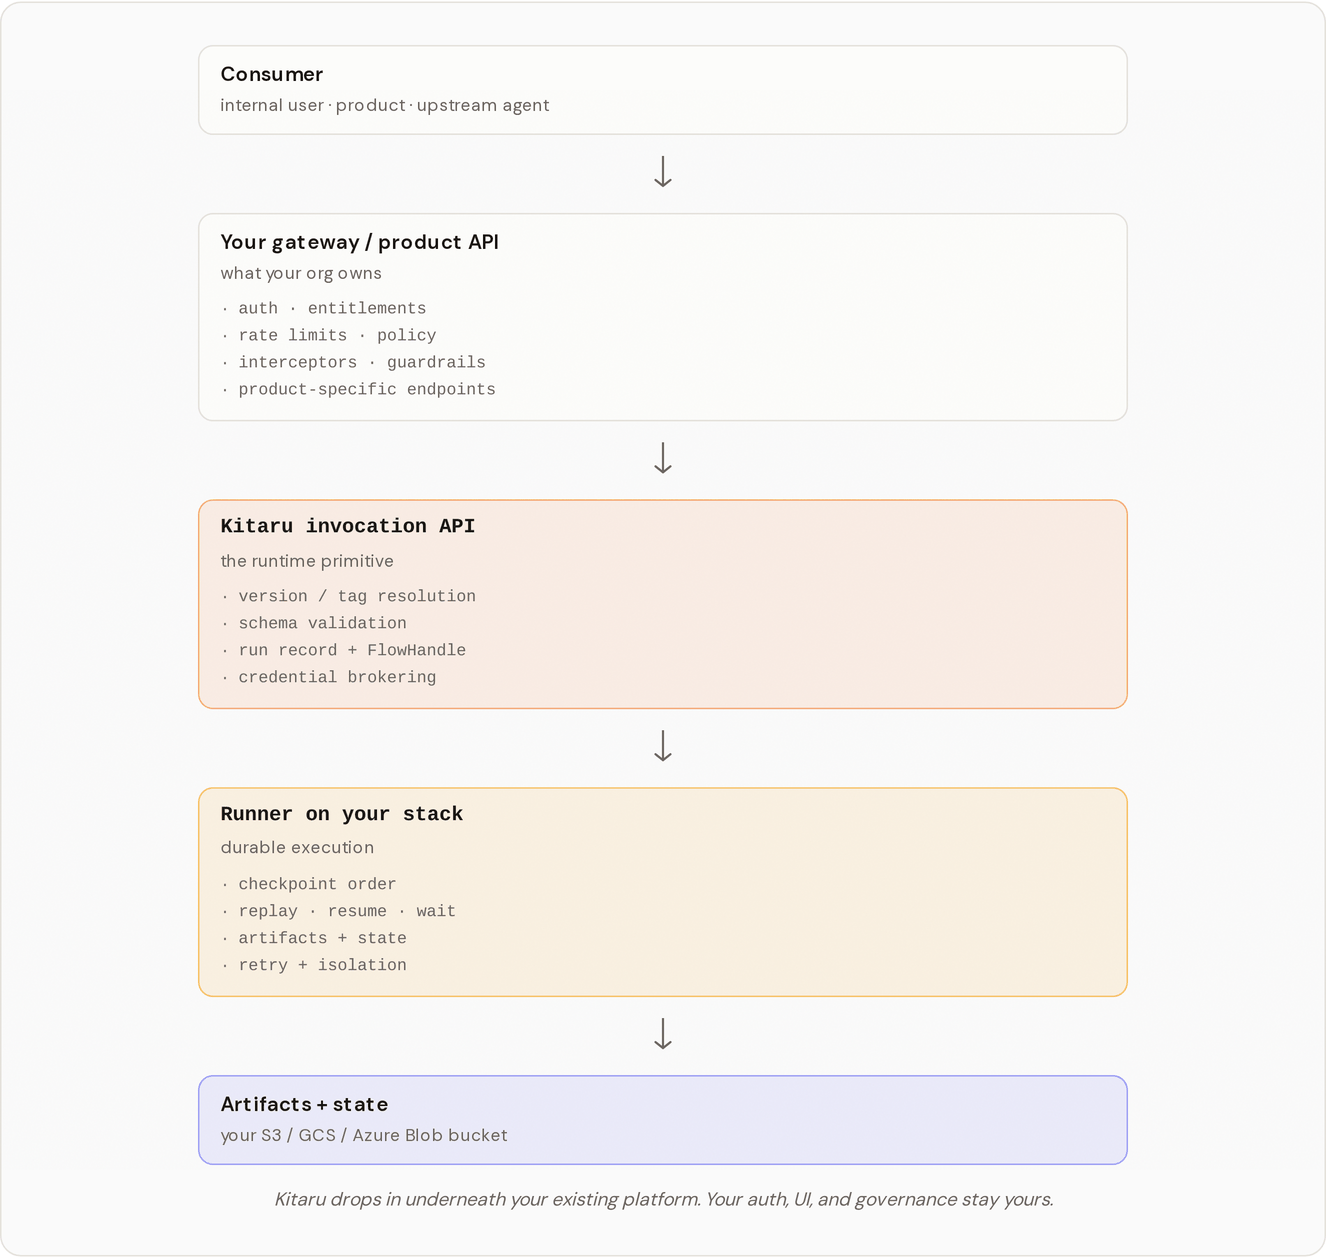
| Harness, Runtime, Platform | Where Kitaru fits in the broader agent stack. | /pages/jFEpVFR4YYhJvoEp1r9K |
| Flows | The outer durable boundary of a Kitaru run. | /pages/fRZF8ymHawJ9ME3mH2F1 |
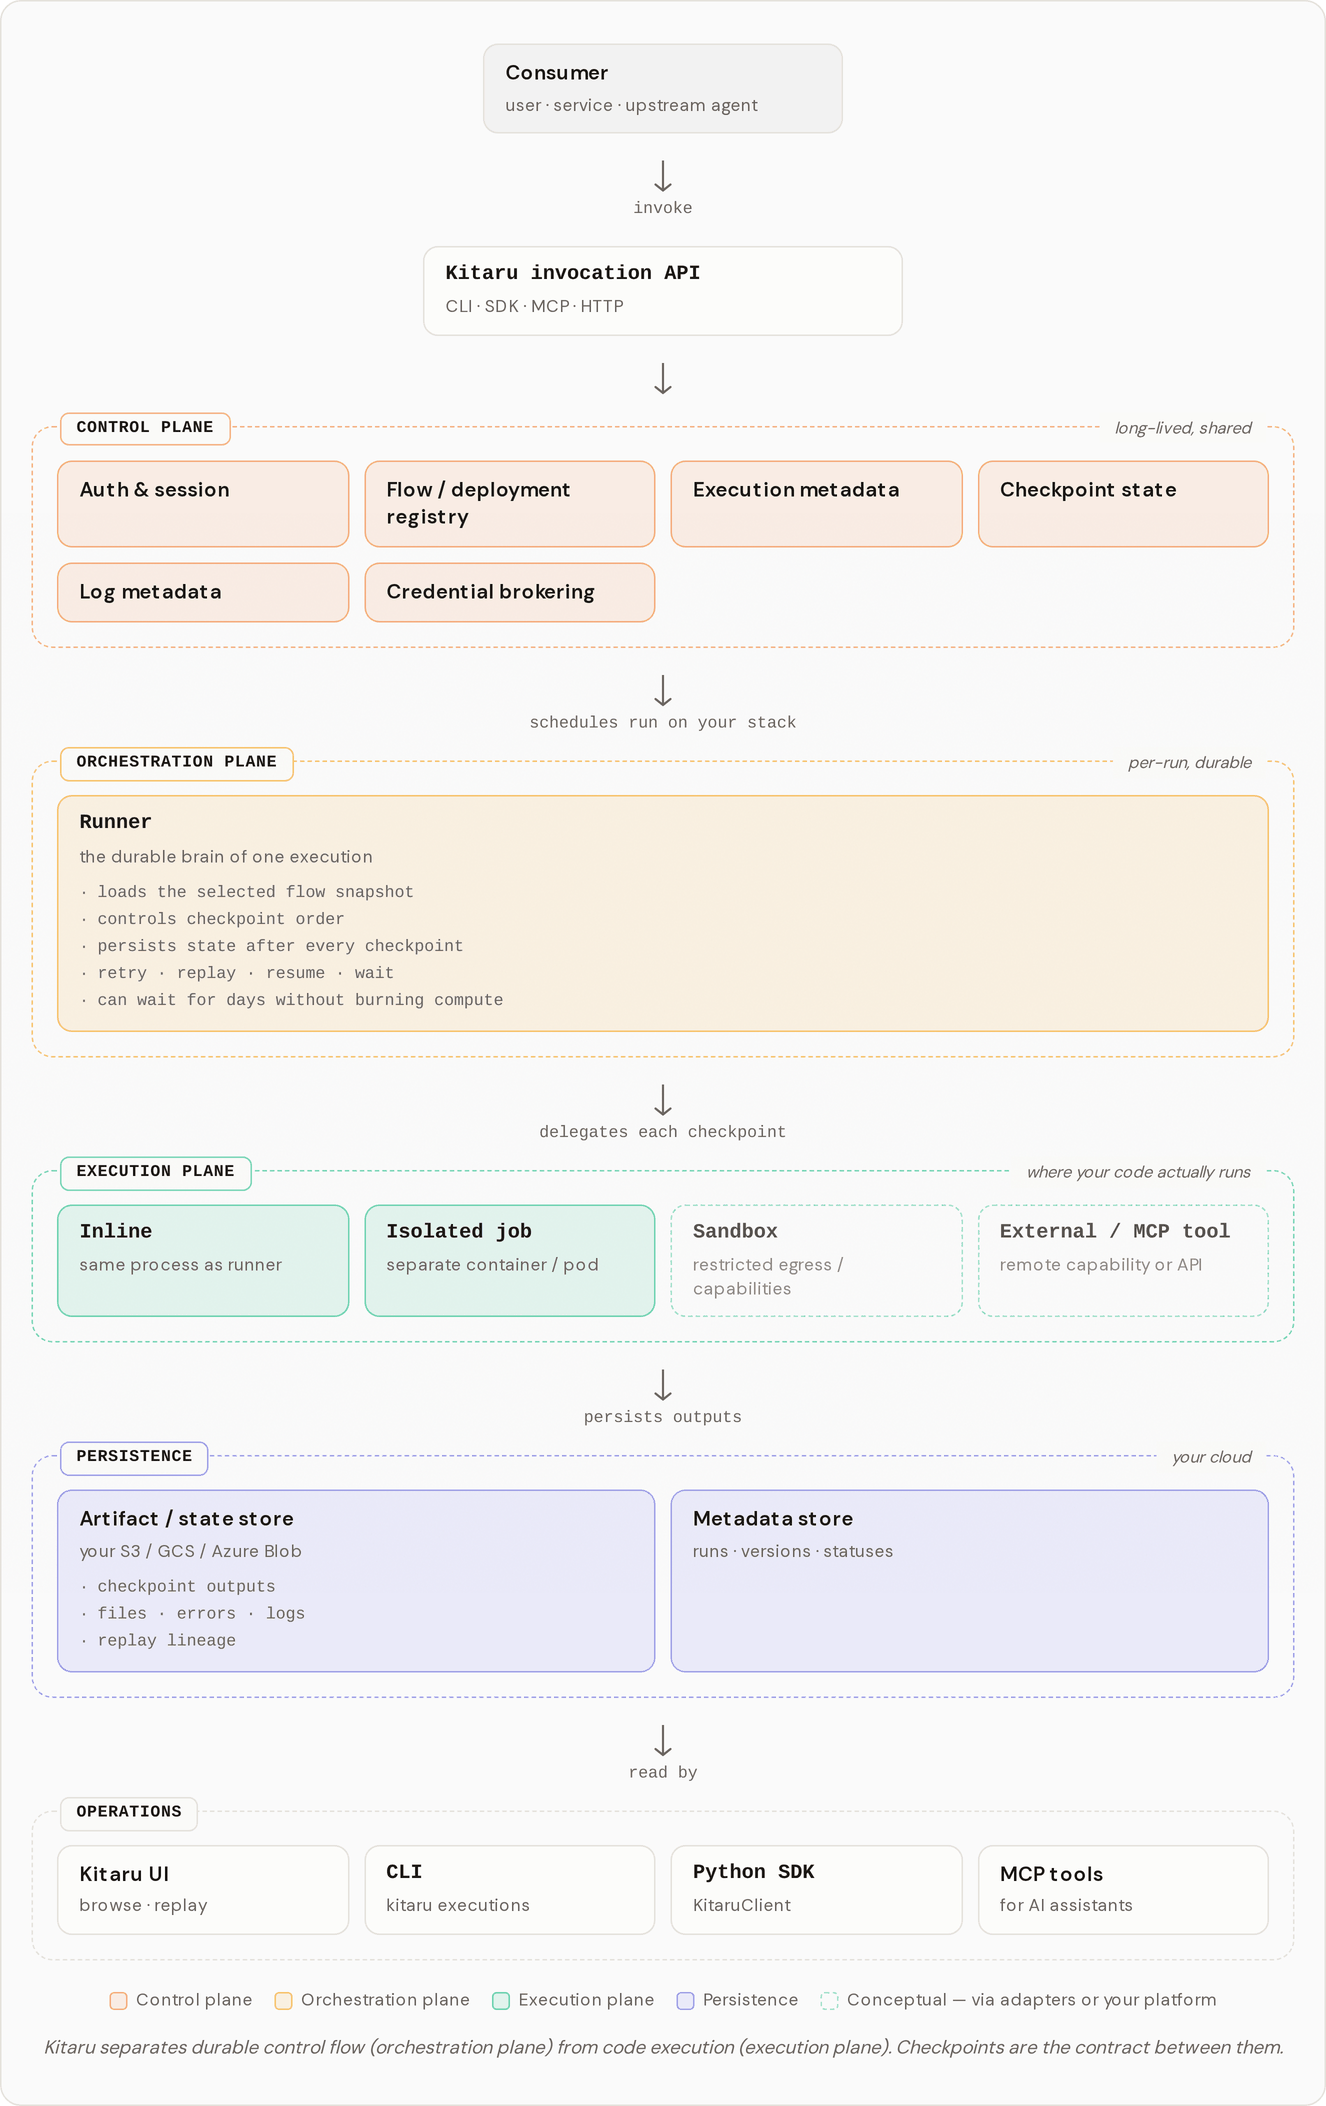
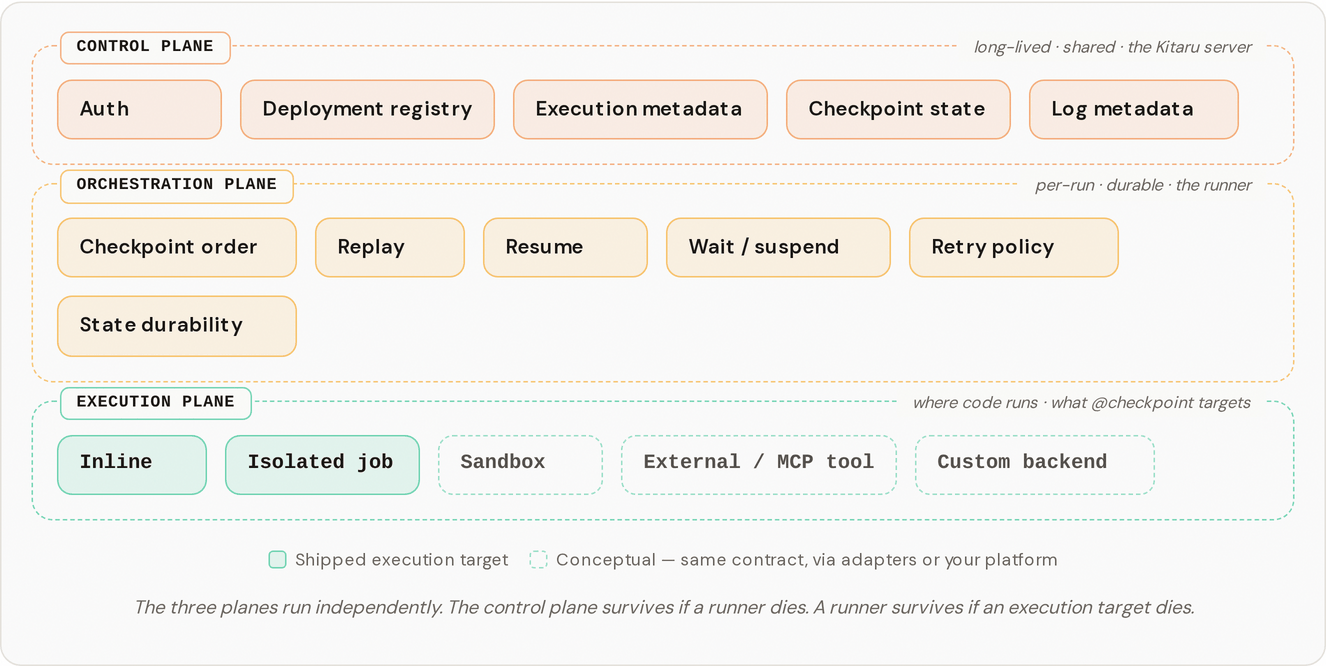
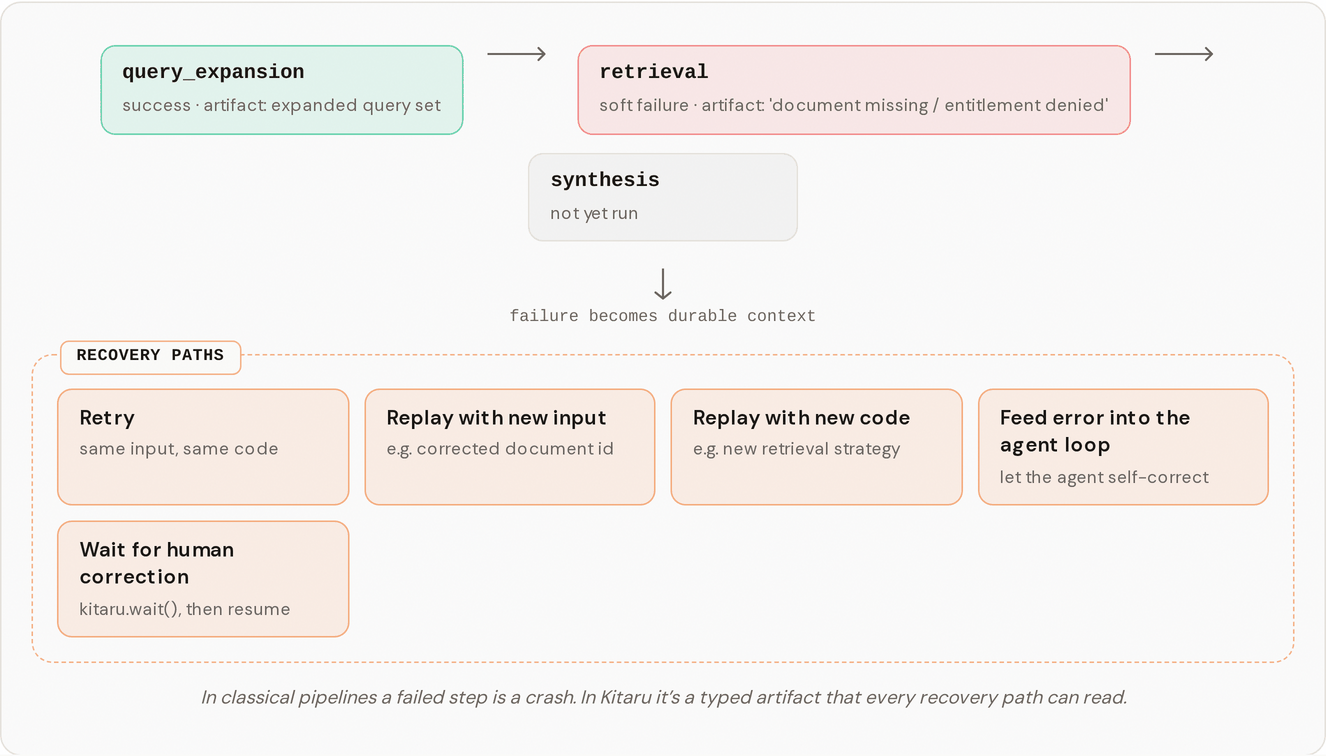
| Checkpoints | Durable work units. The contract between the runner and execution targets. | /pages/Zt6utJ6bxTsCzHn1d3At |
| Wait and Input | Pause a run, release compute, resume when input arrives. | /pages/Reg9c1xq7a9VmWf7JrvJ |