> For the complete documentation index, see [llms.txt](https://docs.zenml.io/llms.txt). Markdown versions of documentation pages are available by appending `.md` to page URLs; this page is available as [Markdown](https://docs.zenml.io/kitaru/agent-harness-platform/05-typed-services.md).
# Typed Services
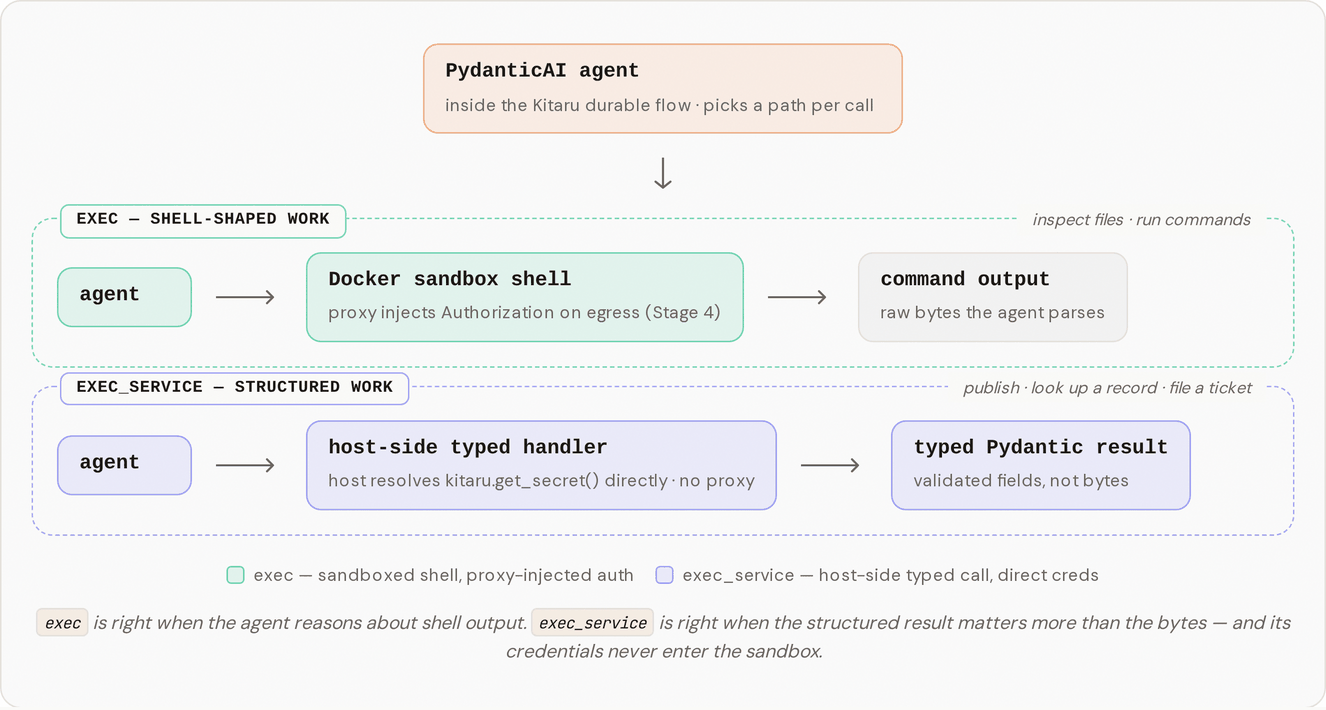
By the end of [Stage 4](/kitaru/agent-harness-platform/04-credential-proxy.md), the agent could call internal HTTP endpoints without ever holding a secret. It ran `curl http://wiki.local/...` inside the sandbox, the proxy added the `Authorization` header on the way out, and the token never touched the agent or its container. The credential problem was solved.
What stayed unsolved is the shape of the interaction. A `curl` is a fine way to hit an endpoint when the agent is poking around and reasoning about whatever comes back. It is an awkward way to take a specific, structured action, the kind where the agent has a defined input in mind and cares about a defined result. Stage 5 gives the agent typed service tools for exactly that: it names an action, fills in the arguments, and gets a structured result back. The action runs in your host process, behind a dispatcher you control.
{% hint style="info" %}
This walkthrough uses `stage_5_typed_services.py` from the runnable Agent Harness Platform example. If you have not cloned the repo yet, start with [Get the code](/kitaru/agent-harness-platform/agent-harness-platform.md#get-the-code) on the overview page.
{% endhint %}
## When a shell is the wrong shape
Picture the agent at the end of its task. It has a two-sentence summary written, and the next thing it needs to do is post that summary to a team channel. With only the `exec` shell, the only way to do that is to assemble the whole HTTP call by hand: the right URL, a `POST`, an `Authorization` header in the exact format the endpoint wants, and a JSON body with every required field named correctly. Then it has to read the response and decide whether it worked.
Every one of those is a place the model can slip. It posts to the wrong webhook. It drops a required field and the request comes back `400`. It gets a `500`, reads the error body as if it were a normal response, and reports success anyway. A shell is the right tool when the agent is genuinely reasoning about command output, reading a file or grepping a log. It is the wrong tool the moment the agent wants to do one specific structured thing and the result, not the raw bytes, is what matters.
Stage 5 adds a second tool, `exec_service`. The agent keeps `exec` for shell-shaped work, but now it also has a set of named services it calls with typed arguments and gets a typed result back. Two of them ship with the example:
* `lookup_wiki` takes a topic string and returns wiki snippets as structured objects, not a blob of text the agent has to parse.
* `publish_summary` takes a summary string, posts it to a webhook, and returns the `message_id` and timestamp the webhook handed back.
The agent only sees the services this profile allows. The `exec_service` tool's description is built from the profile's `allowed_services` set, so an agent that isn't allowed to publish never sees `publish_summary` in the tool description. Here is how the two paths run side by side:
## Run it
### One-time setup
Stage 5 uses the same `setup.sh` as the earlier stages, plus one new secret (`webhook-token`) for the publish call. It is idempotent, so re-running it is safe even if you already ran it for an earlier stage.
```bash
bash setup.sh
```
Then run the stage:
```bash
DISABLE_CACHE=1 uv run python stage_5_typed_services.py
```
`DISABLE_CACHE=1` forces every checkpoint to re-execute, the same flag the earlier stages use, so you get a clean run while you are learning instead of cached output. The agent follows a skill that mixes both paths on purpose: `exec` to read some OS facts out of the sandbox, then `exec_service` for the typed lookup and publish. At the end it prints a `Published ...` line.
## What you should see in the logs
The run prints a log that interleaves the container startup, the agent's tool calls, and the final result:
```
[mock-services] Started container … (host=http://localhost:54321)
[proxy] Started container … (injecting for hosts=['wiki.local'])
[sandbox] Started container … (proxy-wired)
Kitaru: Checkpoint `default` started.
[sandbox] $ cat /etc/os-release
[sandbox] → exit=0, stdout=286 chars, cwd=/workspace
[sandbox] $ uname -r
[sandbox] → exit=0, stdout=17 chars, cwd=/workspace
[mock-services] GET /snippets/durability (host=localhost:54321, auth=Bearer w…) → 200
[mock-services] POST /webhooks/team-summaries (host=localhost:54321, auth=Bot we…) → 200
Kitaru: Checkpoint `default` finished in 26.5s.
[sandbox] Stopping container …
[proxy] Stopping container …
[mock-services] Stopping container …
Published at : .
```
The summary text is whatever the model wrote this turn, so it changes from run to run. The structure is what stays put: `` and `` come back as typed fields from `publish_summary`, and the agent drops them into the line.
The part to notice is what's missing. The two `exec` commands show up as `[sandbox] $ ...` lines, because they ran inside the worker container. The `lookup_wiki` and `publish_summary` calls have no `[sandbox]` lines at all. They appear only as the two `[mock-services]` HTTP lines, because they ran in your host process and went straight to the service. The `[proxy]` line shows up only at startup and teardown; it sits idle through the whole turn, because nothing routed an HTTP call through the sandbox during the service work.
## What just happened?
The agent did two different kinds of work, and Stage 5 sent each down its own path.
The OS-info steps are genuinely shell-shaped. The agent runs `cat /etc/os-release`, reads the output, and reasons about it. That is what `exec` is for, and it runs where Stage 2 put it: inside the sandbox container, isolated from your machine.
The lookup and the publish are not shell-shaped. `lookup_wiki` has a fixed input (a topic) and a fixed output (wiki snippets). `publish_summary` has a fixed input (a summary) and a fixed output (a message id and a timestamp). For those, the agent never built an HTTP request. It named the service, handed over typed arguments, and `exec_service` ran the matching handler in your host process. The handler resolved its own credential with `kitaru.get_secret(...)` and made the call itself.
That host-side path is why the proxy stayed idle for the service work. The proxy from Stage 4 injects credentials for HTTP that leaves the sandbox; the service handlers never enter the sandbox, so there is nothing for it to inject into. The separation is deliberate too: a webhook token or an internal control-plane credential never has to travel into the sandbox network at all. Two credential paths, for two kinds of work:
| Path | Where it runs | How it gets its credentials |
| ---------------------- | ---------------------------- | --------------------------------------------------------------------- |
| `exec` (shell) | inside the sandbox container | the proxy injects the `Authorization` header on the way out (Stage 4) |
| `exec_service` (typed) | in your host process | the handler resolves `kitaru.get_secret(...)` itself (Stage 5) |
## Try one small change
Want to see the permission boundary do its job? Open `stage_5_typed_services.py` and narrow the profile's `allowed_services` from both services down to just the lookup:
```python
allowed_services={"lookup_wiki"},
```
Re-run with `DISABLE_CACHE=1`. The agent can still look up the wiki snippet, but `publish_summary` is no longer in the tool description it sees, so it has no way to post. You will watch it do the lookup and then report that it can't publish, rather than quietly calling an action it was never granted. That set is the list of actions this agent is allowed to take. Shrink the set and the agent's reach shrinks with it.
## How the pieces fit together
Adding a service touches a small set of files, each with one job:
* `agent_harness_platform/services/schemas.py` holds the Pydantic models for each service's arguments and result (`LookupWikiArgs`, `LookupWikiResult`, `PublishSummaryArgs`, `PublishSummaryResult`, `WikiSnippet`).
* `agent_harness_platform/services/registry.py` maps each service name to its `(args_model, handler, summary)` triple in `ALL_SERVICES`, and `build_service_description(allowed)` renders the tool description from the set of allowed services.
* `agent_harness_platform/services/lookup_wiki.py` and `publish_summary.py` are the host-side handlers. Each resolves its credential with `kitaru.get_secret(...)` and makes one HTTP call to the mock.
* `agent_harness_platform/tools.py` builds the `exec_service` tool. It validates `args` against the right Pydantic model on every call, so a malformed argument dict comes back to the agent as a `ValidationError` it can read instead of crashing inside the handler.
* `agent_harness_platform/profile.py` adds the `allowed_services` field, which is what the tool description is built from.
* `mocks/server.py` adds the `POST /webhooks/{webhook_id}` endpoint (Discord-shaped, returns `{message_id, posted_at}`, auth via `Authorization: Bot webhook-token`).
* `mocks/runner.py` publishes the mock on a free host port and exports `AGENT_HARNESS_PLATFORM_MOCK_BASE_URL` so the handlers can reach it.
* `skills/with-services/default-agent/SKILL.md` is the procedure the agent follows: `exec` for the OS-info steps, `exec_service` for the lookup and publish.
Two design choices are worth calling out. The tool takes a flat `(service_name, args)` shape rather than a typed union of every service, because some model providers handle JSON-Schema `oneOf`/`anyOf` inconsistently; a plain `service_name: str` plus `args: dict` is reliable across providers, and the body re-validates by constructing the right args model from the chosen name. And HTTP failures come back to the agent as typed results, not exceptions: `lookup_wiki` and `publish_summary` catch `urllib.error.HTTPError` and return a result with an error-shaped field (`topic=""` or `message_id=""`), so the model can reason about the failure instead of the turn blowing up.
## From mock to real
Everything the services talk to here is a local mock (`mocks/server.py`), not a real internal API, and each handler holds a single credential resolved from a Kitaru secret. The shapes are realistic, a wiki lookup and a Discord-style webhook publish, but the endpoints stand in for whatever your platform actually exposes.
For a real fork, swap the mock handlers for your services and add per-service authorization at the typed boundary. It is the natural place to enforce which agent may call which action, the same boundary you narrowed by hand in the experiment above. Adding a service is three files: a `.py` handler, an args-and-result Pydantic pair in `schemas.py`, and an entry in `ALL_SERVICES`. The tool and its description pick up the new service on their own. A real platform skill can mix both paths freely: `exec` to grep a logfile inside the sandbox, then `exec_service` to file a typed record in your ticketing system.
## Where this leaves us
The agent now has two clean ways to act. It reasons over command output with `exec` inside the sandbox, and it takes specific, structured actions with `exec_service` through a dispatcher you control. Between the sandbox, the skill files, the credential proxy, and now typed services, you have narrowed what the agent can do down to a set of actions you actually approve of.
But narrowing is not the same as judgment. Some of those approved actions still should not happen on the model's say-so alone. Posting that summary to a live channel can't be undone once it fires, and some forks in a task are genuinely a person's call. The next stage gives the agent a way to stop and ask one, then pick the run back up once the answer comes in.
---
# Agent Instructions
This documentation is published with GitBook. GitBook is the documentation platform designed so that both humans and AI agents can read, navigate, and reason over technical content effectively. Learn more at gitbook.com.
## Querying This Documentation
If you need additional information that is not directly available in this page, you can query the documentation dynamically by asking a question.
Perform an HTTP GET request on the current page URL with the `ask` query parameter, and the optional `goal` query parameter:
```
GET https://docs.zenml.io/kitaru/agent-harness-platform/05-typed-services.md?ask=&goal=
```
`ask` is the immediate question: it should be specific, self-contained, and written in natural language.
`goal` is optional and describes the broader end goal you are ultimately trying to accomplish on behalf of the user. GitBook uses it to tailor the answer towards what is most useful for that goal.
The response will contain a direct answer to the question and relevant excerpts and sources from the documentation.
Use this mechanism when the answer is not explicitly present in the current page, you need clarification or additional context, or you want to retrieve related documentation sections.